Eleven seconds of screen recording
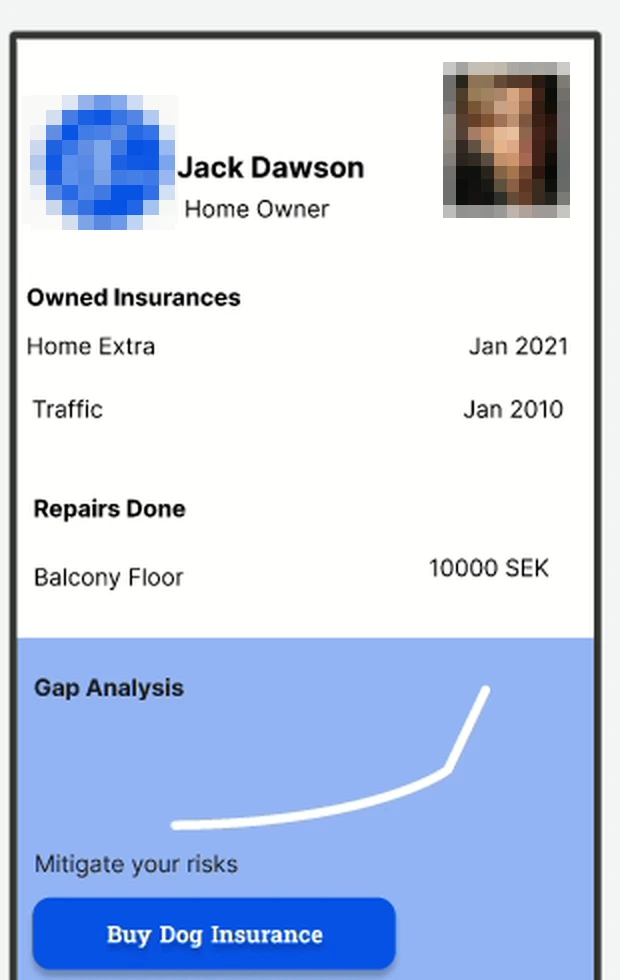
A customer profile. Two policies with the dates they started. One repair, with a number next to it. A section called Gap Analysis containing a curve with no axis, no unit and no scale, under the words Mitigate your risks. Then the button.
It demos well. Everything on it is true, the information architecture is defensible, and an insurer would recognise every element. That's the problem — it's a picture of what the insurer already knows, reorganised for the customer, with the insurer's next sale at the bottom.
Nothing on that screen answers the only question the customer has, which is: what am I actually exposed to, and is it worth doing anything about?
The chart was decoration and the button was extraction
Two failures, and they're the same failure. The Gap Analysis curve rises to the right, which reads as risk goes up, but it has no units, so it cannot be checked, argued with, or acted on. It's a picture of concern. And the button below it doesn't come from the chart — it comes from the product catalogue. Dog insurance was the easiest thing to attach to a homeowner, so it went on top.
A gap analysis that always terminates in a purchase isn't an analysis. It's a funnel with a chart on it.
The test I now apply to any recommendation surface: can it ever produce the answer "do nothing", or "the cheaper option is not ours"? If it can't, the customer will work that out faster than you will, and every future recommendation is discounted to zero — including the ones that would have saved them money. In insurance that discount is expensive, because the entire category runs on a promise you can't inspect until the day you need it.
The repairs list was the asset the whole time
Sitting mid-screen in the original, styled like an afterthought, was a section called Repairs Done — a balcony floor, resealed, 10 000 SEK. I had treated it as history. It's the only thing on that screen the insurer cannot buy, model, or infer.
An insurer prices a home from its postcode, its build year and its claim history: cheap data, shared with every competitor, and years out of date. What it cannot see is the state of your bathroom membrane — the single largest driver of Nordic home claims. Establishing that costs an inspection, which costs more than the risk is worth on any one home. So the industry doesn't look. It prices the average, and every well-maintained home subsidises a neglected one.
The customer holds that information already, in a drawer, as receipts. So the trade is: you give us evidence of what you've maintained; we give you back the cover you're currently paying for and can't claim on. Not a discount — a discount is a promotion. Evidence changing what your policy actually does.
- For the customer — an exclusion disappears, or a risk stops being theirs, at no extra premium.
- For the insurer — property-level ground truth at a fraction of inspection cost, and a reason to be in the app more than once a year.
- The byproduct — cross-sell that finally has a defensible basis, because it now only fires when the customer has no cheaper option.
That reframe is what the rebuilt prototype demonstrates. The dog insurance button still exists. It's now third in the list, priced honestly, on a screen that tells you it's a weak deal.
Four choices, and what each one cost
Every one of these makes the product worse on a metric someone is measured on. That's how you know they're decisions and not preferences.
Rank risks by the customer's expected loss, not by attach rate
Water damage (85 000 kr of exposure) sits above the rebuild sum, which sits above the dog. The original ordering was the reverse — easiest sale first.
Put the free door before the paid one
On the water damage screen, "I already renovated it — add the receipt, free" is listed above "Add water extension, 79 kr/mo". Customers who have already fixed the problem take the free path and we lose the sale. That loss is the mechanism: it's what buys the right to be believed on the next screen.
Make one number falsifiable
"3 of 5 identified risks covered" can go down. It moves when you act, and it implies a claim we can be wrong about. A satisfaction score or a green shield cannot be wrong, which is why they're everywhere.
Show the inputs, including the ones we refuse
The profile screen lists what feeds the model — your log, aggregated postcode claims, the public building register — and states that bank and credit data are not used. In a market where pricing is regulated and trust is the product, the constraint is the differentiator, so it belongs in the interface rather than in the privacy policy.
The rebuilt prototype
Clickable, with real state — log the bathroom renovation and the dashboard, the coverage count and the policy's exclusion list all change behind you. Toggle PM notes for the reasoning attached to each screen: what it optimises for, what it deliberately refuses to do, and where I think it's still wrong.
What's real here, and what isn't
Because a prototype that doesn't say this is just a nicer-looking claim.
- Real — the artefact and the framing
- The 2024 prototype, the screens, and the strategic reframe are mine, from the Antler cohort. The rebuild is a 2026 reconstruction: same concept, sharper argument, better craft.
- Not real — every number on screen
- 85 000 kr, the 61% postcode claim share, clause 4.2, the premiums. Plausible, Nordic-shaped, invented. No insurer's actuarial data was used and none is implied.
- Not real — the underwriting
- "A receipt removes an exclusion" is the load-bearing assumption and it is genuinely hard: it needs a verification standard, a fraud model, and a regulator comfortable with evidence-based clause variation. The prototype asserts this works. It doesn't show that it does.
- Real — the interaction
- State changes persist across screens. Nothing is a hotspot over a static image, and there is no network call, no account and no tracking in this page.
What would kill this, and the cheapest way to find out
In order of how likely each is to be the thing that ends it.
The whole model needs voluntary maintenance records from people who don't currently keep them. Test: a landing page offering the exclusion removal for one uploaded receipt — no app, no product. If receipt uploads don't clear a double-digit percentage of a warm insurer list, the mechanism is dead and nothing downstream matters.
If checking a receipt costs more than the risk-selection benefit, this becomes an expensive loyalty app. Test: price a manual verification workflow on 200 real receipts against the actuarial value of correctly reclassifying those homes. That's a spreadsheet and two underwriters, not a build.
Anti-selection in reverse — well-maintained homes self-report and get cheaper, everyone else stays silent and gets repriced upward. Commercially fine; reputationally and possibly legally not, in EU markets. Test: take it to a regulator before an engineer.
This product asks an incumbent to lose attach-rate now for better loss ratios in three years. That's an org design problem, not a product one, and it's the reason concepts like this usually die inside carriers rather than in the market.
Where I still think this is wrong
The prototype is a consumer app, and I don't think that's where this belongs. The unit that actually controls a Nordic apartment's water risk is the housing association, not the resident — it books the stack inspection, it holds the maintenance plan, and it is the entity an insurer can underwrite as a portfolio. A consumer log fights for attention against every other app on the phone. An association log is someone's job.
I'd also cut the coverage score. It's the most attractive object on the home screen and the least honest one: "3 of 5" quietly implies the five are exhaustive, when the model only knows what it's been told. A product built on showing its inputs shouldn't lead with a number that hides them.
Rebuilt August 2026 from the original April 2024 screen recording. The prototype is a single self-contained HTML file — no build step, no dependencies, no network calls.