Case study · Interactive prototype
Agstya.charge
Three decisions determine whether an EV charging site makes money — where to build it, what it returns, and what to charge this hour. Today they're made by three different people in three different tools, so the price the operator eventually charges was never an input to the siting decision that made it necessary. This is those three decisions as one loop.
- Type
- Self-directed prototype
- Built
- 2026 · one file, no frameworks
- Data
- Synthetic, generated in-browser
- Markets
- Bengaluru · Amsterdam
The problem
Charging infrastructure is capital-intensive and slow to correct. Put a site in the wrong place and you don't find out for eighteen months, by which time the money is in the ground. The decision is made with real data — traffic counts, grid records, land registries — but that data lives in different departments, is bought in different formats, and gets assembled into a spreadsheet whose assumptions nobody can reconstruct a year later.
Meanwhile the operator running the finished site sets a price every hour with almost none of that context, and the investor's model gets updated annually if at all. Three decisions, one asset, no shared spine.
What it does
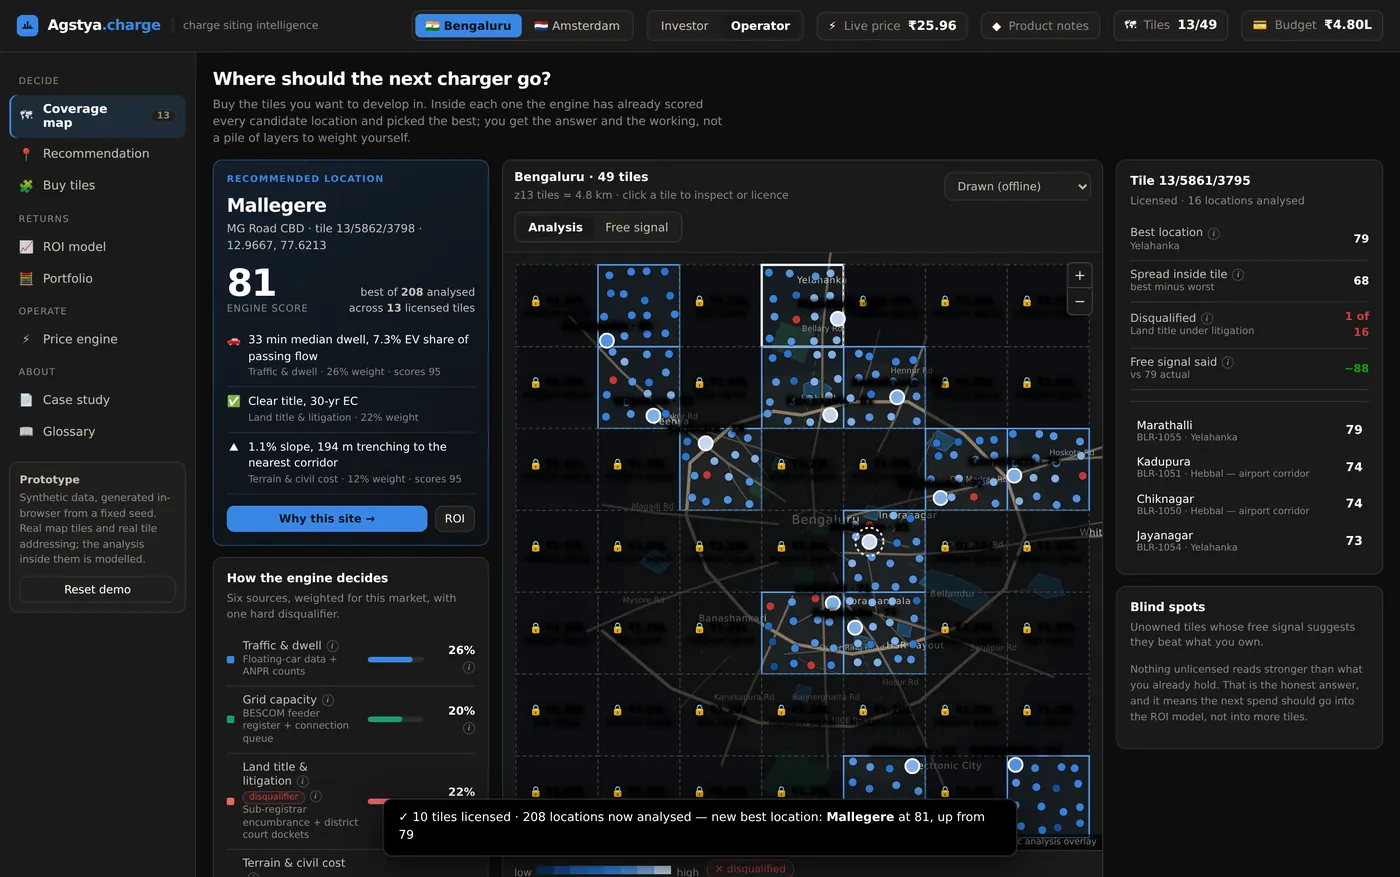
Siting. The metro is divided into real slippy-map tiles — the same
z/x/y grid every web map uses, about 4.8 km across in Bengaluru. Licence a tile
and the engine reveals sixteen analysed candidate locations inside it, scored against six
sources, with the best one pinned and defended.
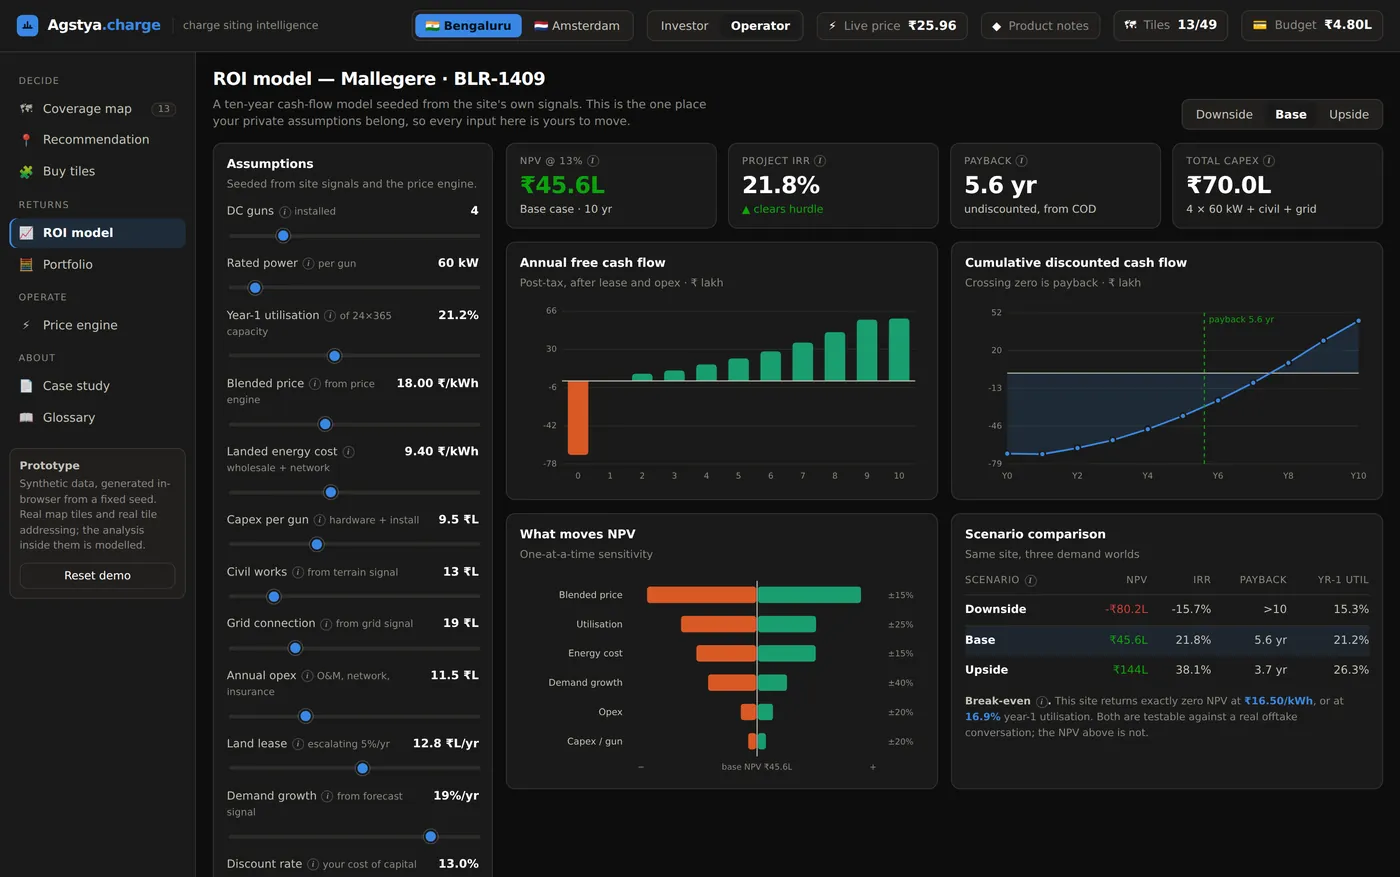
Returns. The recommended location seeds a ten-year cash-flow model — utilisation, civil cost, grid connection cost and demand growth all pre-filled from that site's own signals, then yours to move. It reports NPV and IRR, but it leads with the price and utilisation at which the site breaks even, because that's the number you can go and test.
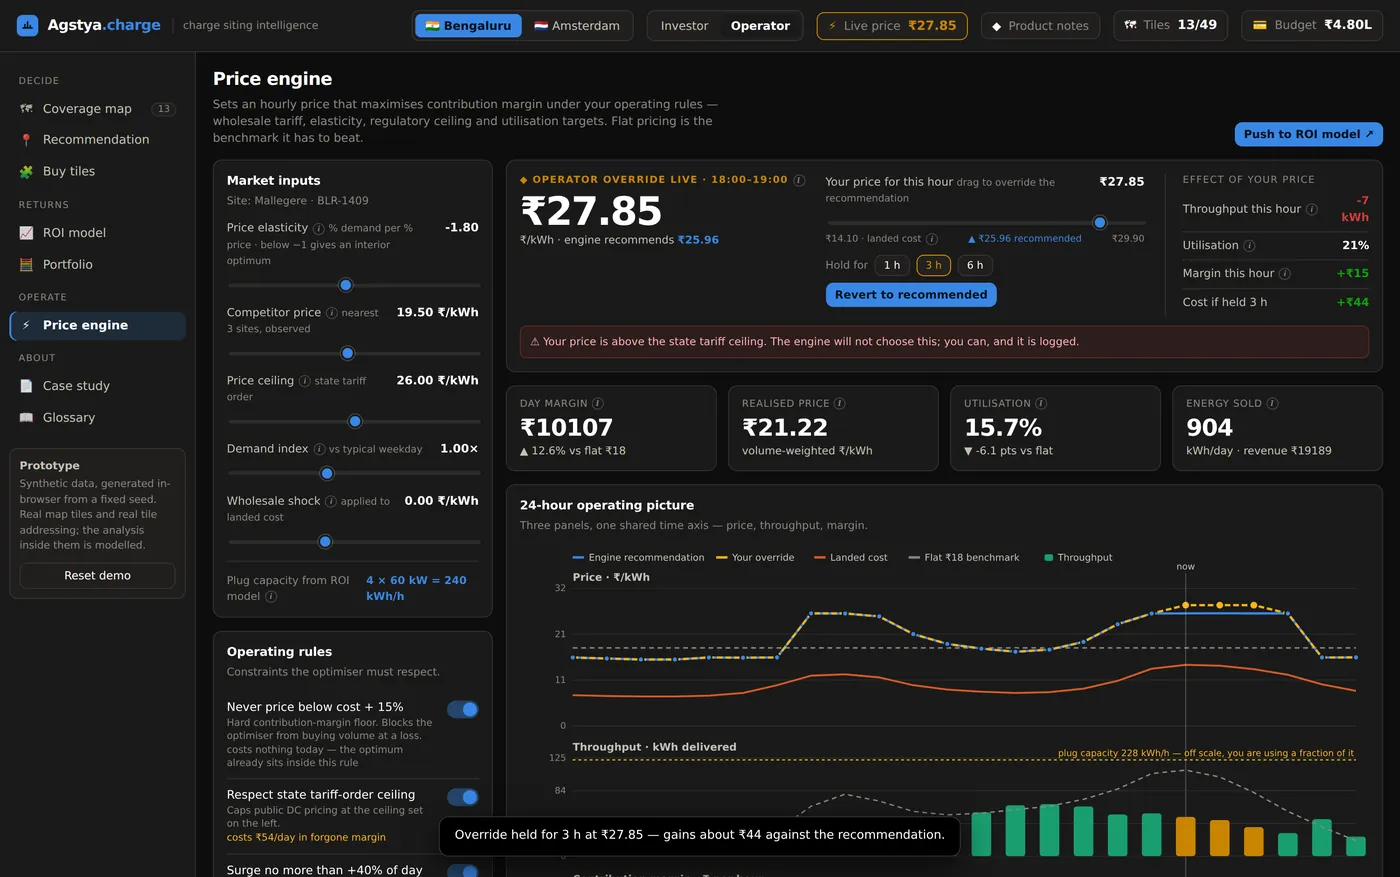
Pricing. An hourly optimiser sets the price against wholesale tariff, elasticity, competitor position and a set of operating rules, and shows what each rule costs per day to hold. The price it recommends for the current hour is front and centre — and overridable.
The loop closes: the price engine's realised price pushes into the returns model, and the returns model's installed capacity feeds back into the price engine. Change a pricing rule and the NPV of the site moves.
The four calls I made
1. The sellable unit is a map tile, not a data layer
The obvious business model is to sell data layers — traffic, grid, land title — as subscriptions. I sold geography instead. A layer prices a capability; a tile prices exposure. It scales with how much capital the customer is actually deploying, it renews when they expand into a new corridor, and it makes churn visible one tile at a time instead of all at once at renewal. It's also addressed the way their GIS team already addresses geography, so it needs no explanation in a procurement meeting.
2. The system gives the answer, not the ingredients
An earlier version of this exposed the six sources with weights the user could tune. It felt powerful and it was wrong: tunable weights turn a calibrated model into a surface the user projects their existing belief onto, and then the recommendation carries their bias with the product's authority. Weights are a market parameter the engine owns and publishes. The user's leverage is which tiles to licence — a decision they genuinely have private information about.

3. The binding constraint is a market parameter, not a universal truth
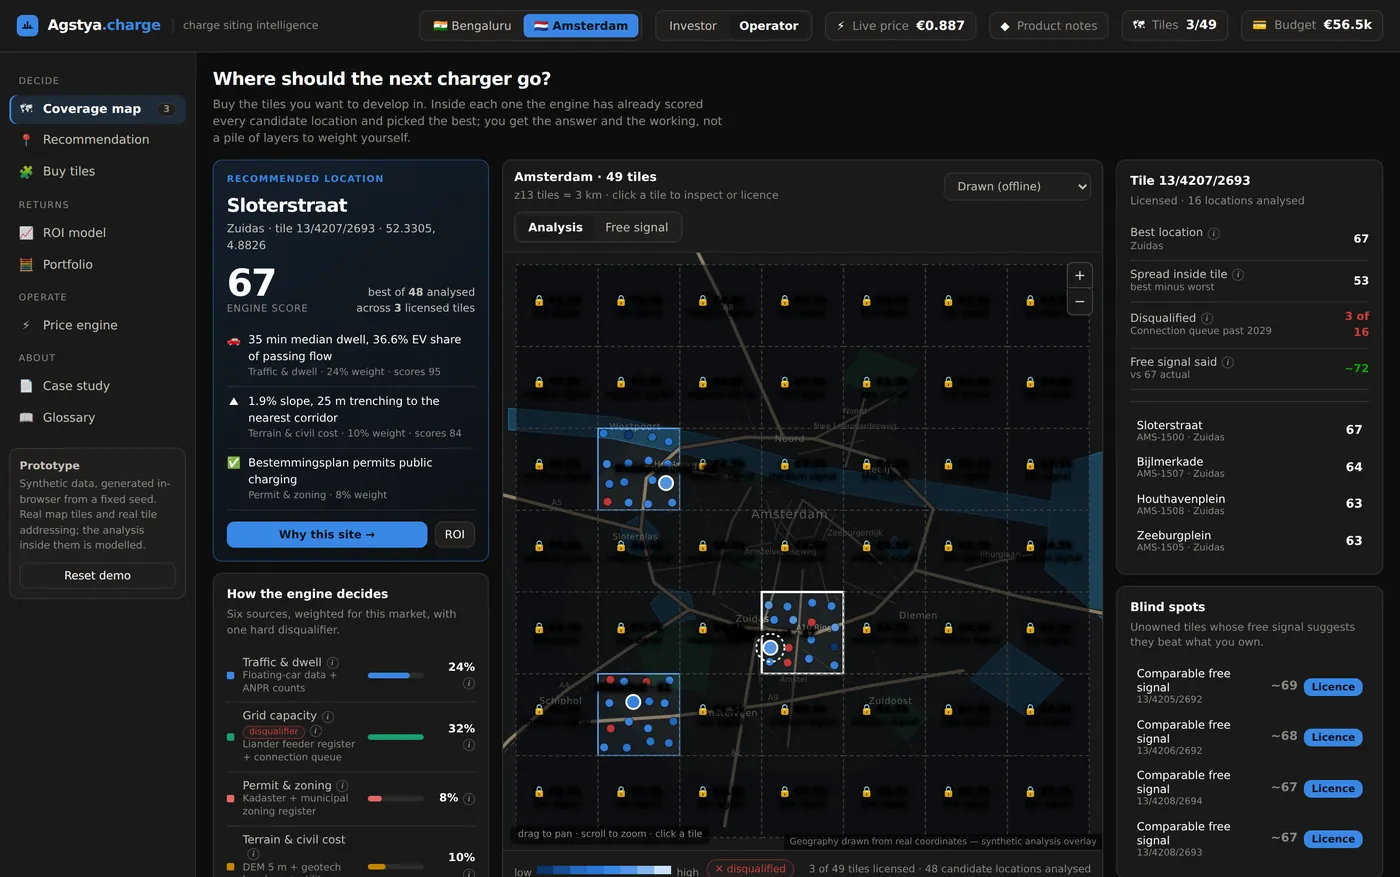
This is the part I'd want to talk through in an interview. In India the thing that kills a charging site is land title: a parcel with a pending suit is not a cheaper site, it's a dead one, and it looks identical to a clean parcel on every other signal. In the Netherlands title is clean and cheap to verify — what kills a site there is a grid connection queue running past 2029.
So the same six sources carry different weights in each market, and the hard disqualifier moves from land title to grid capacity. Toggle the market in the header and watch it happen. A platform that shipped one global weighting would be quietly wrong in every market except the one it was fitted on.
4. Override is a first-class feature of the pricing engine
Operators override pricing engines. A design that blocks them, or that allows it silently, ends the same way — with the engine switched off. So this one always publishes its recommendation, lets the override happen in one drag, prices the disagreement in the units the operator is measured on, warns when the chosen price breaches a rule, and expires it. An override is a decision about this hour, not a new policy.
What I deliberately didn't build
The mechanic I'm most attached to
Unlicensed tiles aren't blank. Each one shows a coarse estimate built only from open data, with its error stated: roughly this good, give or take thirteen points. After you licence a tile, the inspector shows you what the free signal said next to what the analysis actually found — sometimes flattering, sometimes not.
Publishing that costs a little revenue. It buys the thing a data business actually runs on, which is the buyer believing the number when it says no. There's also a panel that names the tiles you don't own which may be better than the ones you do, and says so plainly when there aren't any.
How I'd know it was working
- Primary: the share of tiles where the customer builds within 400 m of the recommended point. If they consistently build somewhere else inside the tile, the engine is decorative.
- Business: tile renewal rate, and tiles per account over time. Renewal is the only honest measure of whether the analysis got used.
- Operator side: override rate and the margin delta on overridden hours. A low override rate isn't the goal — a profitable one is. If operators consistently beat the engine, the engine is missing a signal they have.
- What would kill it: if realised twelve-month utilisation at built sites turned out to be uncorrelated with the engine score, the product would have no reason to exist. That's a cheap test on around thirty sites, and I'd run it before scaling the data pipeline rather than after.
What's real and what's modelled
Real: the tile addressing, the coordinates, the basemap. The map pulls live raster tiles from a public tile server, and falls back to geography drawn from real coordinates and baked into the file when no server is reachable, so the thing still works offline.
Modelled: everything else. Scores, prices and cash flows are generated in-browser from a fixed seed. The weights are asserted rather than fitted — in production they'd come from a regression against realised utilisation at built sites, and they'd need refitting per market. Demand elasticity is held constant, which is what creates a solvable price optimum and is not how real elasticity behaves. The stated error on the free signal is fabricated rather than measured. All of this is written into the prototype itself, on a screen called "What is fake here, honestly".
Running live above. It also opens full-screen in its own tab via “Open the prototype”.